SN13's Election experiment: A decisive victory for data scraping?
To what extent can social media data help predict the future? In the run up to the Presidential Election, we used SN13 to scrape posts on X for insights. Here's what we discovered.
The votes are in - and in the end, it wasn’t even close. In the build-up to the 2024 US election, we experimented with SN13’s data-scraping capabilities, enabled by our Gravity function allowing us to direct the subnet’s data collection to specific labels.
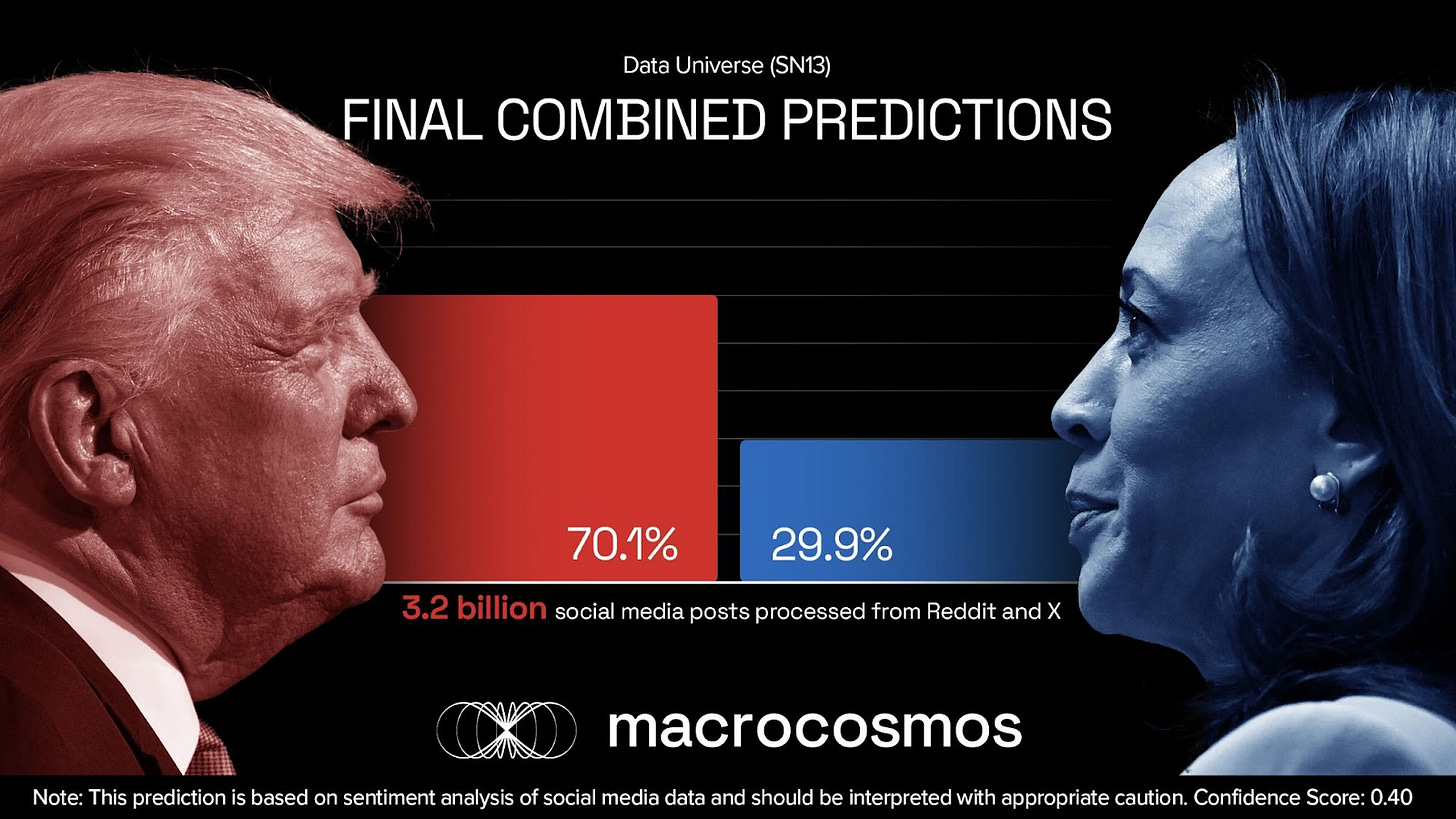
By processing over 3.2 billion social media posts, our aim was to provide an unbiased, data-driven prediction using publicly available information and open-source tools. Sentiment analysis of these posts indicated a marked preference for one candidate: Donald Trump. We calculated that, judging solely from posts on X, Trump had a 71.6% likelihood of winning the White House - a much greater chance of victory than the neck-and-neck race predicted by pollsters.
Now that the election is over, we can analyze the extent to which data scraping can be a useful tool to gauge sentiment, predict events, and anticipate the future.
Why Analyze an Election?
We used SN13, our data-scraping subnet to explore the general sentiment on social media regarding the US election. In particular, we were focused on identifying who would win the election, by collecting posts on X and Reddit and performing sentiment analysis on them. This was made possible with Gravity, our recently released product within SN13 designed to scrape specific terms and phrases. It gives validators the ability to vote on what content they wish SN13 to pick up, offering them greater autonomy over our datasets.
To test its capabilities, we experimented by having it scrape data for the US election. We saw how tight the race looked, and made the bold move to see if we could shed light on the matter by analysing our datasets. Given the fact that SN13 has the largest social media datasets in the world, and that the 2024 Presidential Election the most online of all, we believed it would make for a fascinating and worthwhile test of Gravity.
Methodology
Our approach for analyzing the US election was to take social media posts from Reddit and X, and collect the raw data. This made up 2.2 billion Reddit posts and 1.0 billion X posts spanning from January 1st, 2023, up to October 31st, 2024. Once the data had been captured, we formatted, cleansed, and processed it, so that it could be easily stored in an efficient way that allowed for easy retrieval. DuckDB integration was applied so that we had an optimized database that could be swiftly queried and filtered. Alongside this, we used Parquet processing to store the data in columns, which can be ideal for handling information that you do not plan to edit, but rather are looking to simply analyze, whilst also allowing for compression.
After we created and processed the database, we moved on to filtering the content, so that only relevant media was considered in our analysis. While SN13 collected a total of 3.2 billion posts, after rigorous filtering, only a portion of these were deemed admissible. We narrowed this down by identifying specific keywords and phrases.
We looked for:
General political terms – e.g. Democrat, Republican, GOP, DNC, Conservative, Liberal, Progressive, Swing Voter, Bipartisan
Hashtags – e.g. #Trump2024, Kamala2024, Election2024, #BidenHarris, #SaveAmerica
Current issues during the election cycle – e.g. Indictment, Trial, January 6, Georgia Case, Classified Documents, Immigration, Israel, Gaza, Gun Control
Election-specific keywords – e.g. Election, 2024, Campaign, Vote, Voting, Presidential, Polls, Ballot, Primary, Delegate
Candidate-specific keywords – e.g. Trump, President Trump, Kamala, Kamala Harris, Biden, Vice President, Maga, Potus, VPotus
Once we filtered the data, we were left with 35.6 million posts across the two platforms, which were ripe for performing sentiment analysis. Cardiffnlp’s Twitter-roBERTa-base for Sentiment Analysis was used, which is a well-regarded model fine-tuned to detect opinions within social media posts. It is capable of identifying nuance, sarcasm, and internet-specific language within short-form writing.
Alongside this, it is able to pick up on mixed sentiments, which was extremely important for our analysis, as many political posts contain opinions about both Trump and Harris, as well a both areas of the political spectrum they occupy. In fact, 11% of our data contained mentions of the two individuals together. When this happened, we identified the primary sentiment within the post, and then the secondary sentiment. For instance, for a post stating ‘Trump leads polls while Harris struggles’, the primary sentiment would be isolated, which is a positive statement about Trump’s chances of success, and a secondary statement would be found, which is that Harris is fairing poorly.
While the model is designed specifically for Twitter/X discourse, it is also capable of working with data from other sources. This is especially the case with Reddit, as the communication style on both platforms has significant overlaps when it comes to colloquialisms, abbreviations, and informalities. Nonetheless, the fact that Cardiffnlp’s model was trained namely on X data influenced how confident we were about the analysis on Reddit. Our confidence score on X was 43%, whereas on Reddit it was 37%.
Let’s look closer at these confidence scores, which aggregate to 40%. The first response that may jump out at you is that it seems quite low. This is true especially when compared to official pollsters, which tend to report a 90%+ score. However, there’s an extremely important caveat– a study by the University of California, Berkeley, found that while most polls have confidence scores of 95%, they actually have an accuracy of around 60%.
Interestingly, our SN13 social media analysis followed an opposite trend: we had a relatively low confidence score, yet had a much higher accuracy, as most official polls called a much closer race than the reality. It may even be possible that our analysis correctly indicates that Trump will gain the popular vote, something Republican leaders have not had since 2004. Although votes are still being counted, so this result may not materialize for some time.
Our Results
SN13 and Gravity were able to draw several results. The primary one being that it identified Trump as having a 70.1% chance of winning based on social media sentiment analysis, compared to Harris’ 29.9% chance. As noted, our confidence score for this was 40%.
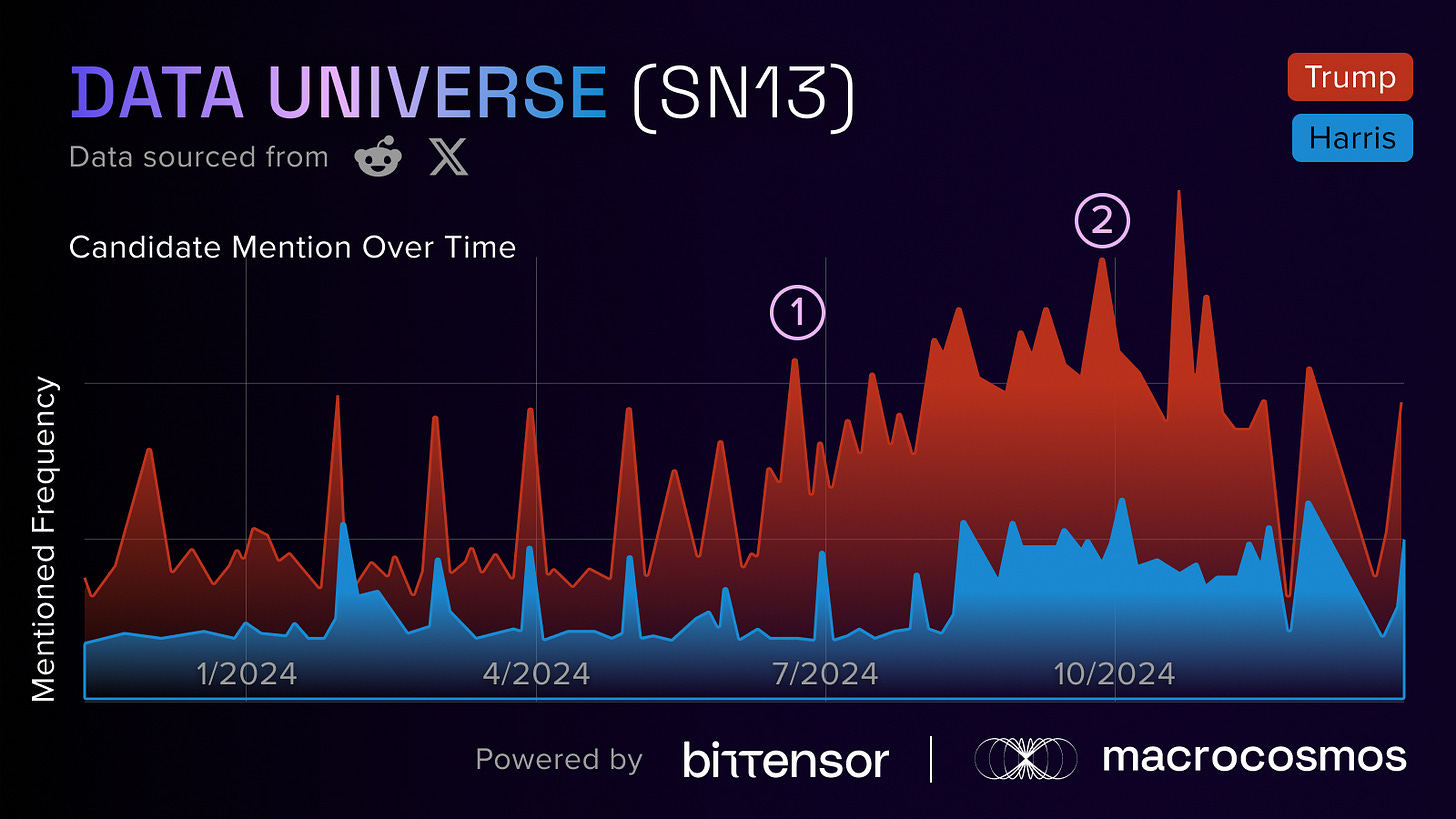
Alongside this, we discovered certain spikes in the discourse around Trump and Harris at particular moments. When we plotted the data on a timeline, we identified moments that led to higher conversations. For instance, we spotted two instances that saw an increase:
Trump’s first assassination attempt
The first debate between Trump and Harris.
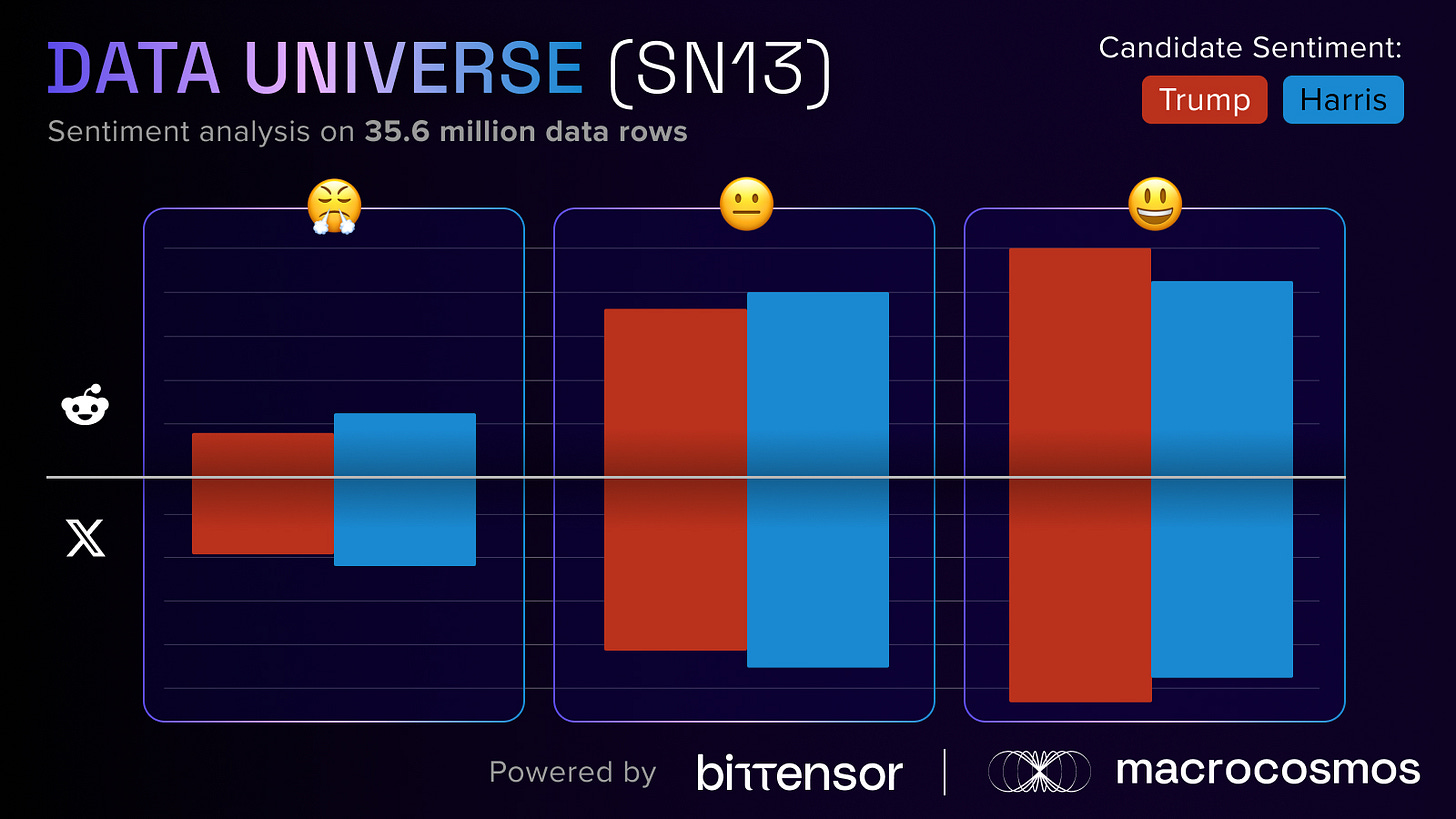
Additionally, we examined the sentiment analysis between the candidates, revealing that both platforms contain more positive statements for candidates than they do neutral or negative ones. A huge contributing factor as to why we predicted Trump had such a high chance of winning is because he had more positive sentiments than Harris, whilst also having fewer negative sentiments than her.
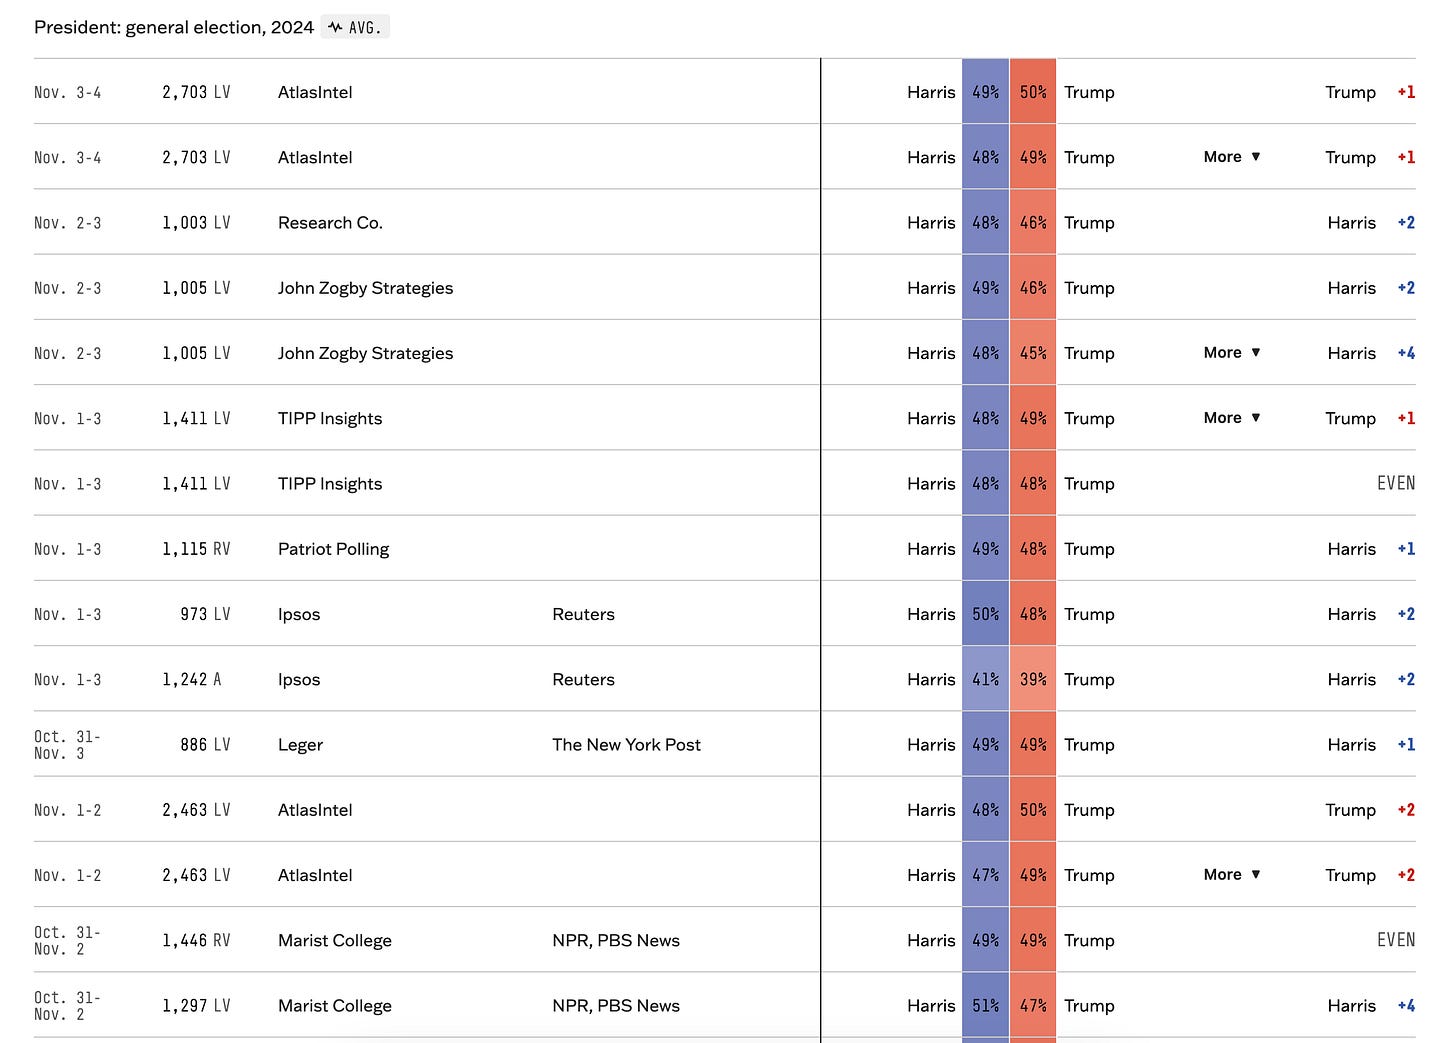
Naturally, the most striking part of this endeavor is how separated our analysis is compared to well-known polling organizations. If you look through FiveThirtyEight, one of the most highly-regarded sources for polling data, you can see that practically every poll has Trump and Harris extremely close to each other.
This is best reflected in FiveThirtyEight’s own aggregated election prediction, where they place Harris as having a 1.2-point lead.
To drive this point home, The Washington Post published an article on November 1st, which included interviews with Brian Stryker, a Democratic pollster for Impact Research, and Bill McInturff, a Republican pollster for Public Opinion Strategies. When asked about the election, Stryker stated “It’s just too close to call”, and McInturff referred to it as “unpredictable”.
This perspective was echoed throughout the US political space. The question now is twofold: why did the pollsters get it so wrong? And why did SN13 get it right?
The two answers may actually be connected. At present, pollsters are quietly licking their wounds and assessing the errors in their models, so it can be hard to find concrete ideas. However, a prevalent theory is that of survey bias, the issue of simply not getting accurate or enough responses from surveys when asking certain demographics. There has been a looming question about whether pollsters actually know how to engage with Trump’s fanbase. Nate Cohn, the Chief Political Analyst for The New York Times, discussed this peril when reflecting on the 2020 election, stating that “[Trump] supporters were less likely to take surveys than demographically similar Biden supporters”.
There are several possible reasons for this. People talk about the phenomena of the shy Trump voter, meaning people who support him behind closed doors for fear of ridicule. However, there is a new emergent reason that we need to be mindful of: the youth vote could be getting missed by pollsters.
This time round, Trump received a large portion of under 30-year-olds, a demographic Republicans tend to struggle with. It’s worth pointing out that this age range has proven tough to monitor from a marketing level, as well as a political one. They do not adhere to conventional research methods, such a picking up phones or speaking directly to people. Rather, they take a more digital approach.
Both of these factors: that of a younger demographic being tougher to decipher, and the potential existence of silent Trump fans could be the reason why SN13 and Gravity did so well compared to the pollsters. Not only is social media an online space that digital natives are highly accustomed to, but it also gives people the opportunity to speak their minds without receiving the type of backlash and discomfort that might exist in more physical spaces. In other words, people can hide behind screens and speak with more confidence.
In this sense, where traditional polling tactics become disempowered, social media statistics seem to pick up the slack.
Limitations within our analysis
Despite the correct prediction, we should not overlook the limitations of our approach. While we aligned greater with how election night unfolded, there is still a chance that it is a coincidence, and that we reached a similar conclusion for largely different reasons.
In particular, our analysis contains four key limitations:
We only used social media data,
We only used two social media platforms, meaning that the demographics we captured would be the dominant ones that use those services,
Our data was focused on public expressions only, meaning it did not take into account previous elections, typical trends in demographics, or any other factors whatsoever,
Our data was not isolated to the US, but rather picked up information from around the globe.
The fourth point there is extremely important, as it means that SN13 and Gravity picked up data that should not have been relevant to the actual election itself. Regardless of whether somebody was a US citizen or situated in a distant country who has no direct relationship to America, their sentiment could have been captured and aggregated.
However, despite this distortion, our forecast was nonetheless accurate. There are many possible answers as to why, but three which are worth considering are:
Our success was coincidental, as our limitations prevent any firm conclusions.
These platforms are used predominantly by US voters, meaning the overlap is large enough to diminish the significance of the limitations,
The general sentiment on social media is leaning towards conservative and right-wing values, either because of global trends or because the platforms’ algorithms disproportionately promote such views.
Of course, without more data and additional methods of analyzing it, we cannot entirely align with any of these perspectives.
Conclusion
The main takeaway from our experiment with SN13 is that Gravity/Dynamic Desirability has great potential for drawing insights from social media data. The election proved to be a fantastic first use case, and demonstration of what Macrocosmos is capable of within the Bittensor ecosystem. It further showed how important open-source datasets are when it comes to prediction models.
Our experiment may have also helped explain why the traditional pollsters were wrong in their estimations of the election. Although, this is a highly contentious point; one that the political world will be breaking down for a while. Perhaps shy Trump voters and conservative Gen Zs really are easier to pick up with a social media scraping tool than they are via traditional methods. But this is relatively uncharted territory, so it is more of a possibility than an outright theory.
Regardless, our election experiments show how SN13, Data Universe, becomes much more powerful when paired with Gravity. This is just one use-case, but there are countless opportunities to tap into social media for hidden insights. If you would like to take part and direct our datasets towards your own interests, all you need to do is be a validator and set the parameters, as Gravity is live right now. Check out our instruction video to see how to use it for yourself, and join our Discord channel to learn more about SN13’s progress.


